Energy yield with PyWake#
This page computes energy yield and wake loss for an OOWL farm with PyWake. Layout optimization with TOPFARM optimizes the same farm.
PyWake is not an OOWL dependency.
%%capture
%pip install --quiet py-wake
Import OOWL and the PyWake components.
import matplotlib.pyplot as plt
import numpy as np
import xarray as xr
from py_wake.literature.gaussian_models import Bastankhah_PorteAgel_2014
from py_wake.site import XRSite
from py_wake.wind_turbines import WindTurbine
from py_wake.wind_turbines.power_ct_functions import PowerCtTabular

import oowl
from oowl import boundaries as B
from oowl import layouts as L
from oowl import resources as R
from oowl import turbines as T
The OOWL farm#
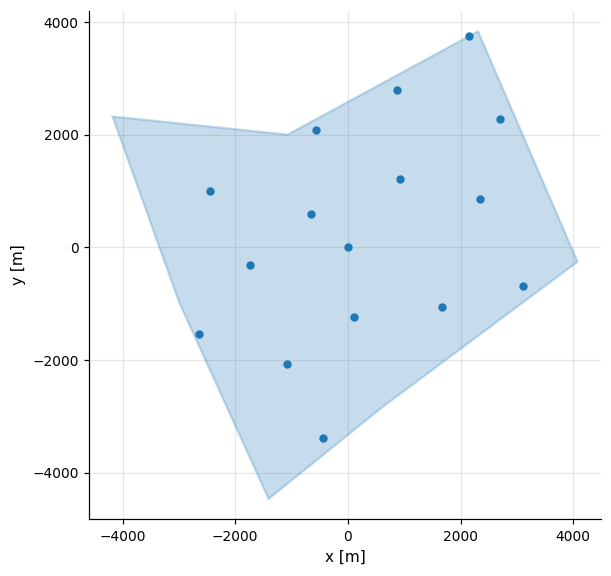
A notched seven-sided 36 km² boundary holds 16 turbines on a Sunflower
spiral under a resource with one dominant direction, defined at hub height.
boundary = B.RandomRadialPolygon(
    n_vertices=7, area=36e6, radius_jitter=0.4, angular_jitter=0.4, seed=16
)
turbine = T.Idealized(
    rated_power=15e6, rotor_diameter=240.0, hub_height=150.0, cp_max=0.48
)
resource = R.WindResource(
    direction=R.VonMises(n_modes=1, seed=3),
    n_sectors=12,
    mean_wind_speed=9.5,
    weibull_k=2.2,
    turbulence=R.SurfaceLayer(intensity=0.07),
    reference_height=turbine.hub_height,
)
farm = oowl.Sampler(
    boundary,
    L.Sunflower(n_turbines=16, seed=5),
    resource,
    turbines=turbine,
    seed=4,
).sample()[0]
farm.plot();
OOWL → PyWake#
OOWL object |
Becomes |
Used for |
|---|---|---|
|
PyWake |
power and thrust |
|
PyWake |
wind climate |
Turbine mapping, OOWL Idealized → PyWake WindTurbine#
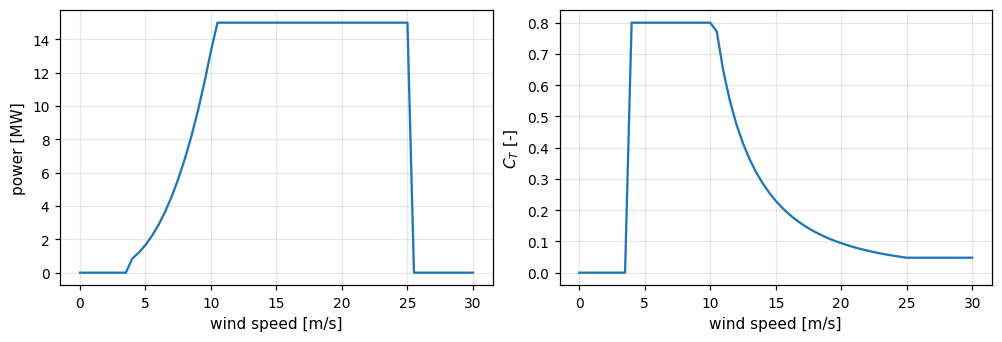
The turbine is sampled on a speed grid. Power is in watts, hence "W".
speeds = np.arange(0.0, 30.5, 0.5)
wind_turbine = WindTurbine(
    name="OOWL idealized 15 MW",
    diameter=turbine.rotor_diameter,
    hub_height=turbine.hub_height,
    powerCtFunction=PowerCtTabular(
        speeds, turbine.power(speeds), "W", turbine.ct(speeds)
    ),
)

fig, axes = plt.subplots(1, 2, figsize=(9, 3), constrained_layout=True)
axes[0].plot(speeds, wind_turbine.power(speeds) / 1e6)
axes[0].set(xlabel="wind speed [m/s]", ylabel="power [MW]")
axes[1].plot(speeds, wind_turbine.ct(speeds))
axes[1].set(xlabel="wind speed [m/s]", ylabel="$C_T$ [-]");
Wind resource mapping, OOWL sectors → PyWake XRSite#
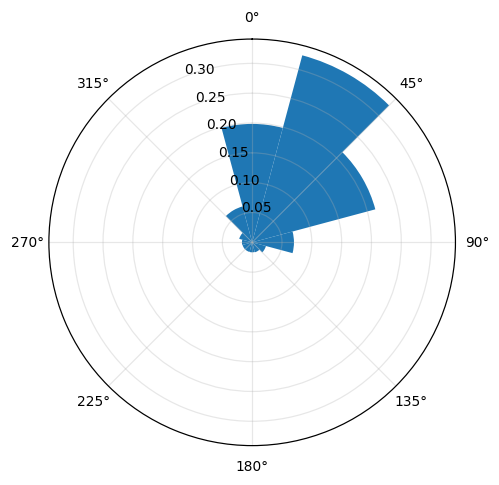
Sector probabilities, Weibull \(A\) and \(k\) and turbulence intensity per sector center (\(\theta_i = 360 i / n\)) transfer directly.
site = XRSite(
    xr.Dataset(
        data_vars={
            "Sector_frequency": ("wd", resource.probability),
            "Weibull_A": ("wd", resource.weibull_a),
            "Weibull_k": ("wd", resource.weibull_k),
            "TI": ("wd", resource.sector_turbulence_intensity),
        },
        coords={"wd": resource.theta},
    )
)
_ = site.plot_wd_distribution(n_wd=12)
AEP and wake loss#
Wake loss is the share of gross AEP lost to wakes, \(1 - \text{net}/\text{gross}\).
wfm = Bastankhah_PorteAgel_2014(site, wind_turbine, k=0.0324555)
simulation = wfm(farm.x, farm.y)

net = float(simulation.aep().sum())
gross = float(simulation.aep(with_wake_loss=False).sum())
print(f"Gross AEP: {gross:8.1f} GWh")
print(f"Net AEP:   {net:8.1f} GWh")
print(f"Wake loss: {100 * (1 - net / gross):8.2f} %")
Gross AEP:   1258.5 GWh
Net AEP:     1186.9 GWh
Wake loss:     5.69 %
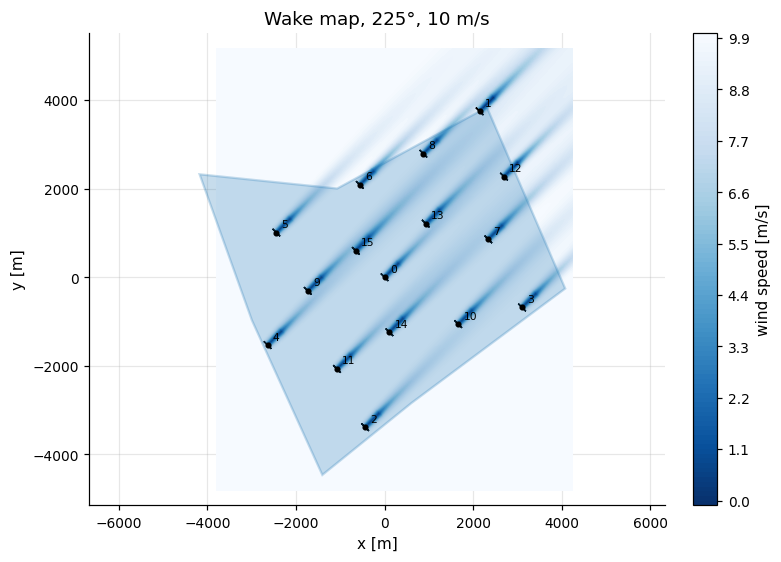
The wake map shows one wind direction.
fig, ax = plt.subplots(figsize=(7, 5), constrained_layout=True)
wfm(farm.x, farm.y, wd=225, ws=10).flow_map().plot_wake_map(ax=ax)
boundary.plot(ax=ax)
ax.set_title("Wake map, 225°, 10 m/s");