Attaching turbines to a farm#
oowl.Sampler(..., turbines=...) takes one Turbine for every position or a
sequence with one model per position. OOWL never invents a turbine-size
distribution.
Positions with the same model must hold the same object. That identity lets
Farm.plot color by model and lets
windIO interchange write one definition per
model. The models share the 15 MW rating and 240 m rotor of Turbine models.
The farms below carry a boundary, a layout and a wind resource besides the turbines.
import matplotlib.pyplot as plt
import numpy as np

import oowl
from oowl import boundaries as B
from oowl import layouts as L
from oowl import resources as R
from oowl import turbines as T
The three models#
Idealized and Controlled generate their curves from design parameters.
Tabulated holds curves, here the controlled model sampled from cut-in to
cut-out.
idealized = T.Idealized(
    rated_power=15e6,
    rotor_diameter=240.0,
    hub_height=150.0,
    cp_max=0.46184,
    ct_rated=0.7783,
    generator_efficiency=0.95756,
    cutin_wind_speed=3.0,
    ct_idle=0.06,
    ct_parked=0.18,
    name="15 MW idealized",
)
controlled = T.Controlled(
    rated_power=15e6,
    rotor_diameter=240.0,
    hub_height=150.0,
    cp_max=0.46184,
    optimal_tip_speed_ratio=9.0,
    minimum_rotor_speed=5.0,
    maximum_tip_speed=95.0,
    ct_optimal=0.7783,
    induction_exponent=0.05,
    generator_efficiency=0.95756,
    cutin_wind_speed=3.0,
    name="15 MW controlled",
)
speeds = np.linspace(3.0, 25.0, 45)
tabulated = T.Tabulated(
    rotor_diameter=240.0,
    hub_height=150.0,
    wind_speeds=speeds,
    power_values=controlled.power(speeds),
    ct_values=controlled.ct(speeds),
    name="15 MW tabulated",
)
One model everywhere#
The farm keeps the single Turbine object, not copies.
boundary = B.SmoothBlob(area=np.pi * 3000**2, roughness=0.2, seed=7)
layout = L.Grid(n_turbines=72, lattice_angle=60, seed=4)
resource = R.WindResource(direction=R.VonMises(n_modes=2, seed=8), n_sectors=12)

scenario = oowl.Sampler(boundary, layout, resource, turbines=controlled, seed=11)
uniform_farm = scenario.sample()[0]

print(f"{uniform_farm.n_turbines} positions")
print(f"one shared model: {uniform_farm.turbines is controlled}")
72 positions
one shared model: True
Several models by position#
A sequence assigns one model per position in the order of Farm.positions.
Cycling three models over 72 positions gives three distinct objects, while a
fresh Idealized per position would give 72 objects configured alike. The
assignment leaves the positions unchanged.
fleet = (idealized, controlled, tabulated)
assignment = tuple(fleet[index % len(fleet)] for index in range(layout.n_turbines))
scenario = oowl.Sampler(boundary, layout, resource, turbines=assignment, seed=11)
mixed_farm = scenario.sample()[0]

standing = mixed_farm.turbines
counts = {model.name: sum(item is model for item in standing) for model in fleet}
print(f"positions per model: {counts}")
print(f"distinct objects: {len({id(item) for item in standing})}")
same_geometry = np.allclose(mixed_farm.positions, uniform_farm.positions)
print(f"geometry unchanged by the assignment: {same_geometry}")
positions per model: {'15 MW idealized': 24, '15 MW controlled': 24, '15 MW tabulated': 24}
distinct objects: 3
geometry unchanged by the assignment: True
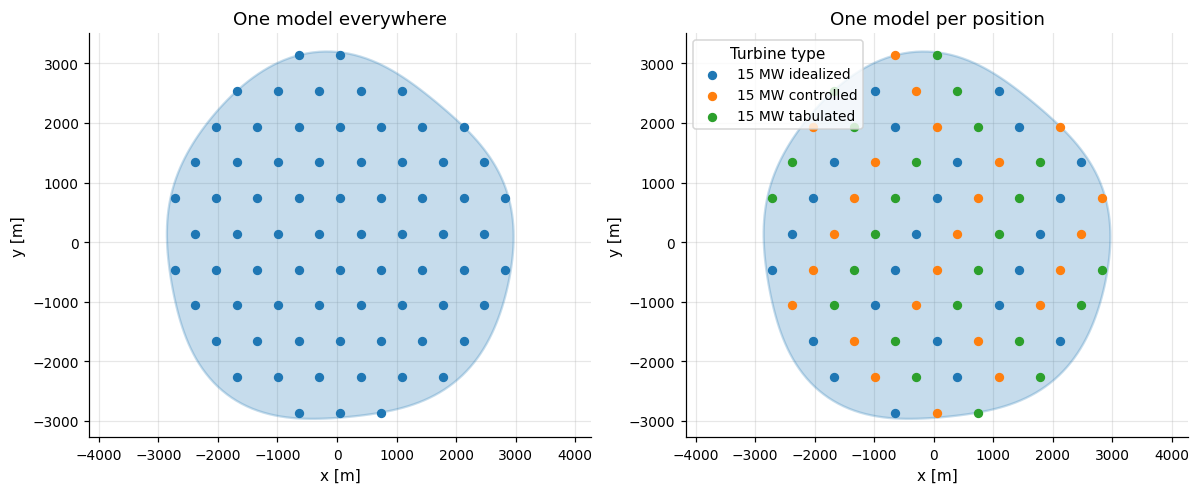
Farm.plot colors a farm of several models by model and builds the legend
itself. An explicit color overrides it.
fig, axes = plt.subplots(1, 2, figsize=(11.0, 4.6))
uniform_farm.plot(ax=axes[0], s=26, title="One model everywhere")
mixed_farm.plot(ax=axes[1], s=26, title="One model per position")
fig.tight_layout()