Combining layout families#
L.Mixture combines the families of Layout families within one farm.
SP.Choice picks one family per farm. Moving a finished layout is a modifier,
covered in Layout modifiers.
import matplotlib.pyplot as plt

import oowl
from oowl import boundaries as B
from oowl import layouts as L
from oowl import sampling as SP

shape = B.Polygon(
    [[-3500, -1800], [2500, -2300], [3800, 200], [1800, 2600], [-2800, 2100]]
)
Mixture#
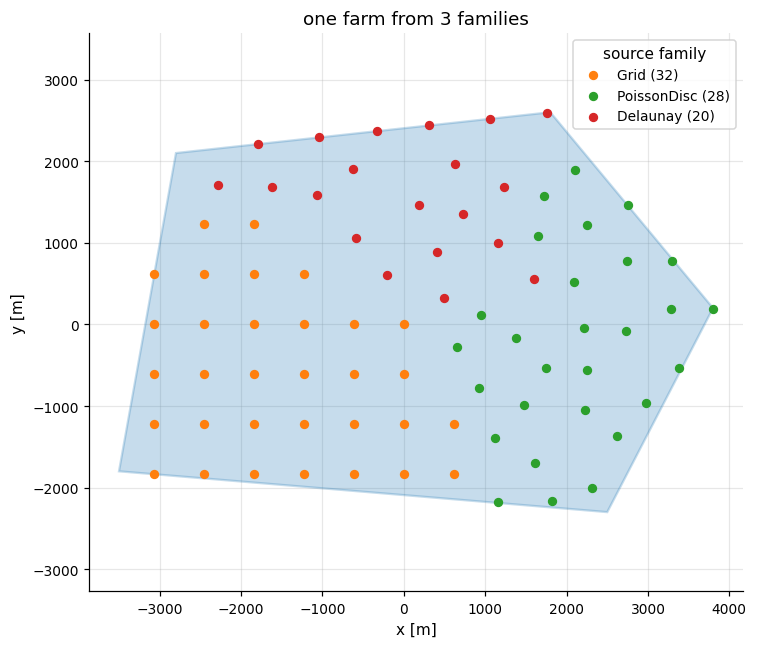
Mixture takes count-free templates and gives each an exact share of one
farm, set by weights, both of its turbines and of its area. The farm is split
into one compact cell per template, and each template is laid out in its own
cell, held clear of the turbines already placed in the cells before it. Each
source is recorded as an index slice in metadata["parts"], and the cells in
metadata["cells"]. Mixture describes how the seams
between cells are filled.
mixture_layout = L.Mixture(
    [L.Grid(), L.PoissonDisc(), L.Delaunay()], 80, weights=[0.4, 0.35, 0.25], seed=0
)
mixture = oowl.Sampler(shape, mixture_layout).sample()[0]

fig, ax = plt.subplots(figsize=(7, 6))
mixture.boundary.plot(
    ax=ax, title=f"one farm from {len(mixture.metadata['parts'])} families"
)
for part in mixture.metadata["parts"]:
    start, stop = part["start"], part["stop"]
    ax.scatter(
        mixture.x[start:stop],
        mixture.y[start:stop],
        s=26,
        label=f"{part['algorithm']} ({stop - start})",
        zorder=5,
    )
ax.legend(title="source family", loc="upper right")
fig.tight_layout()
Choice#
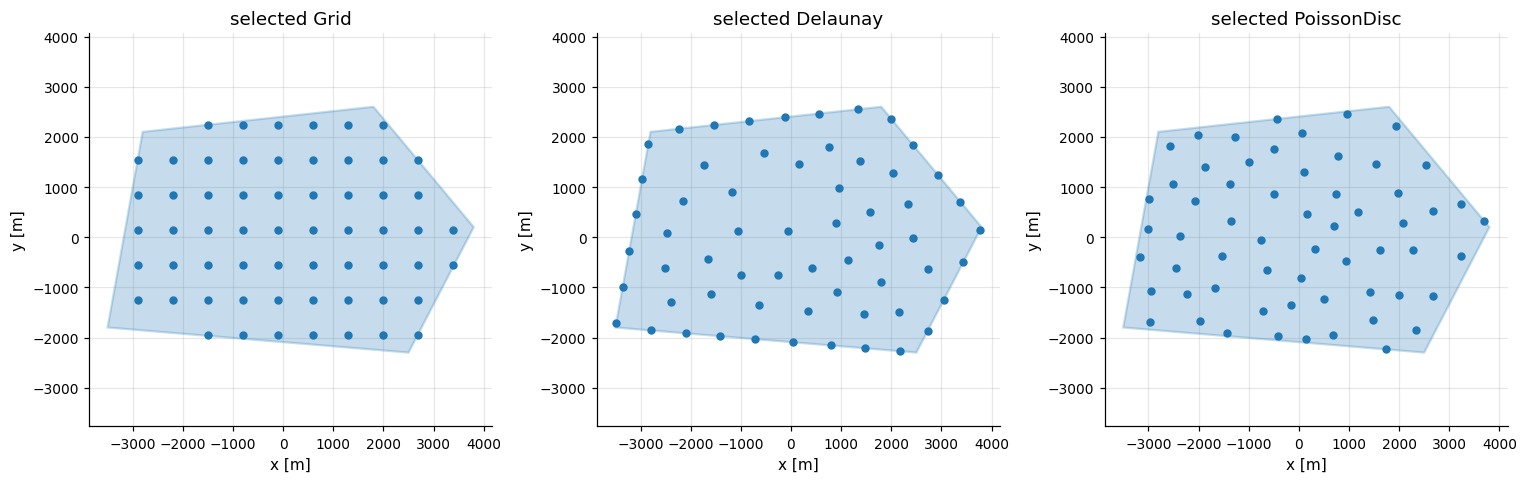
Choice selects one family per farm and applies it to the whole boundary, so
one description yields structurally different farms. Each scenario below draws
its own family, and with n_farms so does each farm of an oowl.Cluster.
choice = SP.Choice([L.Grid(60), L.PoissonDisc(60), L.Delaunay(60)], seed=4)

fig, axes = plt.subplots(1, 3, figsize=(14, 4.5))
for ax, farm in zip(axes, oowl.Sampler(shape, choice).sample(3)):
    selected = farm.metadata["sample"]["layout"]["algorithm"]
    farm.plot(ax=ax, title=f"selected {selected}")
fig.tight_layout()