
Drawing, streaming and replaying a population#
Drawing never consumes a sampler. Concepts explains per-index seeds and what a scenario is, and Describing a population of farms explains the descriptions.
import matplotlib.pyplot as plt
import numpy as np

import oowl
from oowl import boundaries as B
from oowl import layouts as L
from oowl import sampling as SP
from oowl import strings as S
The same population every time#
Scenario i takes a seed derived from the root and its index, so repeated
draws agree and a short draw is the prefix of a long one.
simple = oowl.Sampler(
    SP.Choice([B.OffshorePolygon, B.SmoothBlob]),
    SP.Choice([L.Grid, L.PoissonDisc, L.Delaunay]),
    n_turbines=(40, 90),
    area=(30e6, 90e6),
    seed=7,
)
farms = simple.sample(12)
again, prefix = simple.sample(12), simple.sample(3)
assert all(np.array_equal(a.positions, b.positions) for a, b in zip(farms, again))
assert all(np.array_equal(a.positions, b.positions) for a, b in zip(prefix, farms))
The description decides what a scenario is#
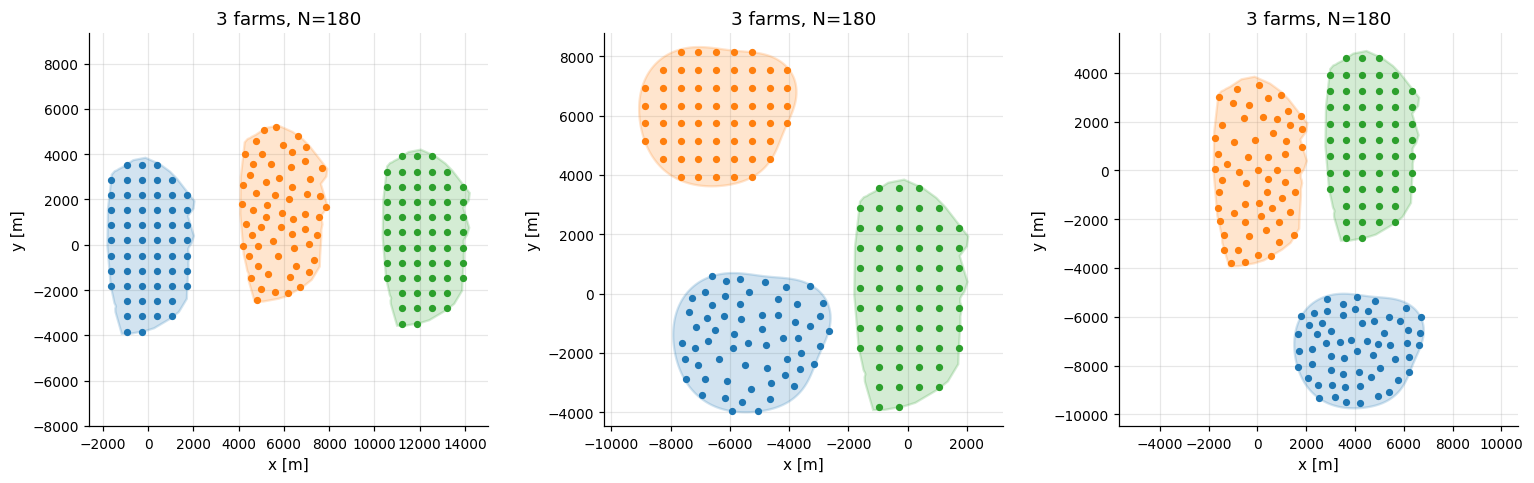
n_farms makes each scenario a Cluster of that many farms, gap meters
apart, and n still counts scenarios. A boundary that lists its own members
needs no n_farms. Members share one coordinate frame and draw their own
layout, so families can differ within a cluster.
clusters = oowl.Sampler(
    SP.Choice(
        [
            B.OffshorePolygon(area=24e6, seed=21),
            B.SmoothBlob(area=20e6, roughness=0.12, seed=22),
        ]
    ),
    SP.Choice([L.Grid(60), L.PoissonDisc(60)]),
    n_farms=3,
    gap=(600, 3000),
    seed=5,
)

fig, axes = plt.subplots(1, 3, figsize=(14, 4.5))
for ax, cluster in zip(axes, clusters.sample(3)):
    cluster.plot(ax=ax, s=14, title=f"{cluster.n_farms} farms, N={cluster.n_turbines}")
fig.tight_layout()
The scenario type follows from the description, so n_farms=1 still gives a
Cluster. Top-level n_turbines, area and density size one
farm, so a cluster sampler refuses them and each
member boundary takes its own area. A built layout stands for the whole
cluster, so its count is the total, shared out by area. A recipe, class or
Choice is drawn per member, so its count is per farm.
blob = B.SmoothBlob(area=30e6)
oowl.Sampler(blob, L.Grid(100), n_farms=5)                    # 100 in total
oowl.Sampler(blob, (L.Grid, {"n_turbines": 100}), n_farms=5)  # 100 each
blob = B.SmoothBlob(area=30e6)
lone = oowl.Sampler(blob, L.Grid(40), n_farms=1, seed=3).sample()[0]
print(type(lone).__name__, lone.n_farms)

try:
    oowl.Sampler(blob, L.Grid, n_farms=3, n_turbines=60)
except ValueError as exc:
    print(exc)
Cluster 1
n_turbines sizes a single farm and cannot size a cluster. A built layout carries the cluster total, as in layout=L.Grid(100) with n_farms=5, and a layout recipe carries each farm's own count, as in layout=(L.Grid, {'n_turbines': 100})
In a cluster, configuration is resolved once per farm before the farms are
placed, so each member sizes itself. Resources and surfaces stay shared by the
whole cluster.
def member_configuration(rng):
    count = int(rng.integers(20, 41))
    return {
        "boundary": (B.Circle, {"area": count * 250_000.0}),
        "layout": (SP.Choice([L.Grid, L.Sunflower]), {"n_turbines": count}),
    }


configured = oowl.Sampler(
    configuration=member_configuration, n_farms=4, gap=600.0, seed=9
).sample()[0]
print([(farm.n_turbines, round(farm.boundary.area / 1e6, 1)) for farm in configured])
[(23, 5.8), (24, 6.0), (25, 6.2), (25, 6.2)]
Strings with or without a polygon boundary#
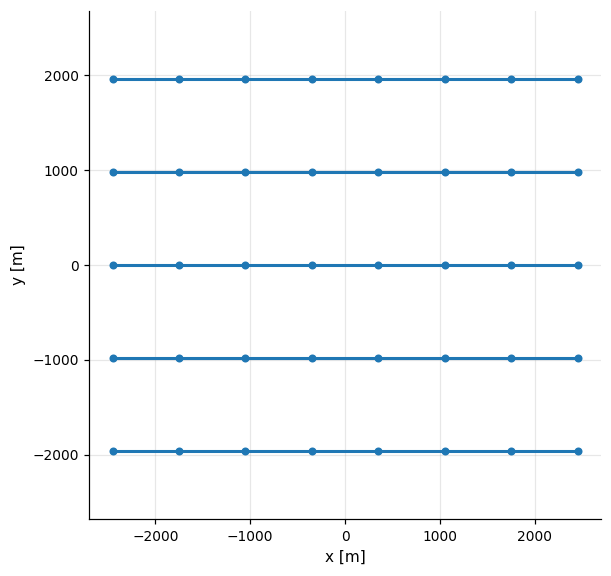
A standalone string layout uses its own spacing in meters and sets
farm.boundary to None. The same layout also fits into a polygon, as in
Describing a population of farms.
standalone = oowl.Sampler(
    boundary=None,
    layout=(
        L.String,
        {
            "strings": (
                S.Parallel,
                {"string": S.Straight, "n_strings": 5, "relative_spacing": 0.2},
            ),
            "density": {"minimum_spacing": 700.0},
        },
    ),
    n_turbines=40,
    seed=17,
)
standalone.sample()[0].plot(s=18);
Replay#
An unseeded sampler still resolves a root seed, recorded under
metadata["sample"]["root"] beside the index and seed. Rebuilding the
description with that root replays the population.
def description(seed=None):
    return oowl.Sampler(
        SP.Choice([B.OffshorePolygon, B.SmoothBlob]),
        SP.Choice([L.Grid, L.PoissonDisc, L.Delaunay]),
        n_turbines=(40, 90),
        area=(30e6, 90e6),
        seed=seed,
    )


drawn = description().sample(3)
replayed = description(seed=drawn[0].metadata["sample"]["root"]).sample(3)
print(all(np.array_equal(a.positions, b.positions) for a, b in zip(drawn, replayed)))
True