
OOWL: Onshore and Offshore Wind Layouts#
OOWL (pronounced /aʊl/ like owl) draws wind farms with an exact turbine count inside a boundary you describe, placed by the method you pick. One description draws one farm or a thousand.
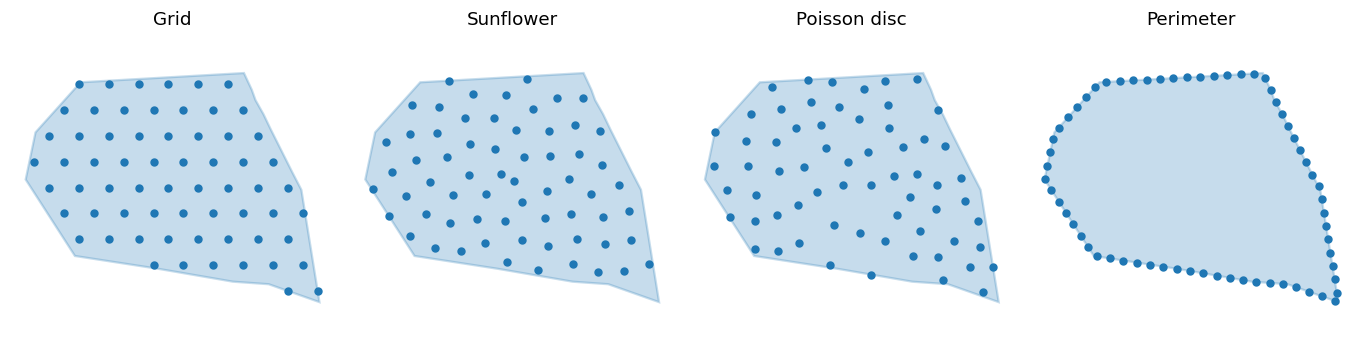
One offshore boundary, four layout families, 64 turbines in every panel.
Install#
pip install oowl
Installation covers pip, pixi, and a development checkout.
Draw one farm#
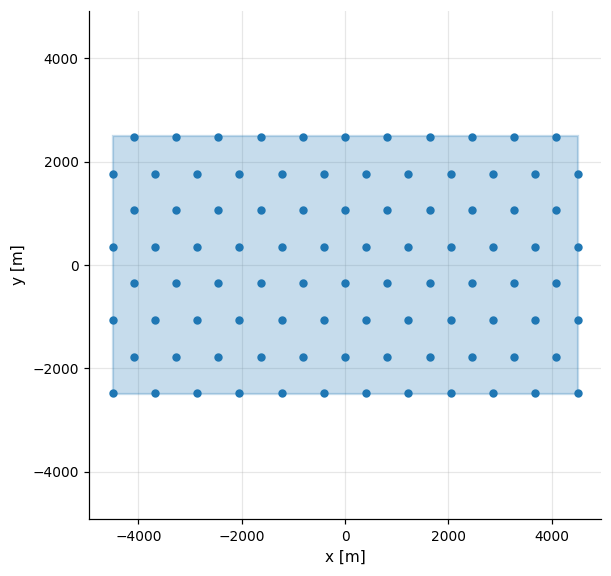
Describe the scenario, then draw from it.
import matplotlib.pyplot as plt

import oowl
from oowl import boundaries as B
from oowl import layouts as L

boundary = B.Rectangle(9, 5, area=45_000_000)
spec = oowl.Sampler(boundary, L.Grid(n_turbines=92, lattice_angle=60, seed=4))

farm = spec.sample()[0]
print(farm.n_turbines, "turbines at", farm.positions.shape, "coordinates")

ax = farm.plot()
92 turbines at (92, 2) coordinates
Draw a population#
Give a value a range and the description becomes a population.
population = oowl.Sampler(
    boundary=B.OffshorePolygon,
    layout=L.Grid,
    n_turbines=(40, 120),
    density={"minimum_spacing": 800.0},
    seed=7,
)

fig, axes = plt.subplots(1, 3, figsize=(11.0, 3.4))
for ax, drawn in zip(axes, population.sample(3)):
    drawn.plot(ax=ax, title=f"n = {drawn.n_turbines}")
fig.tight_layout()
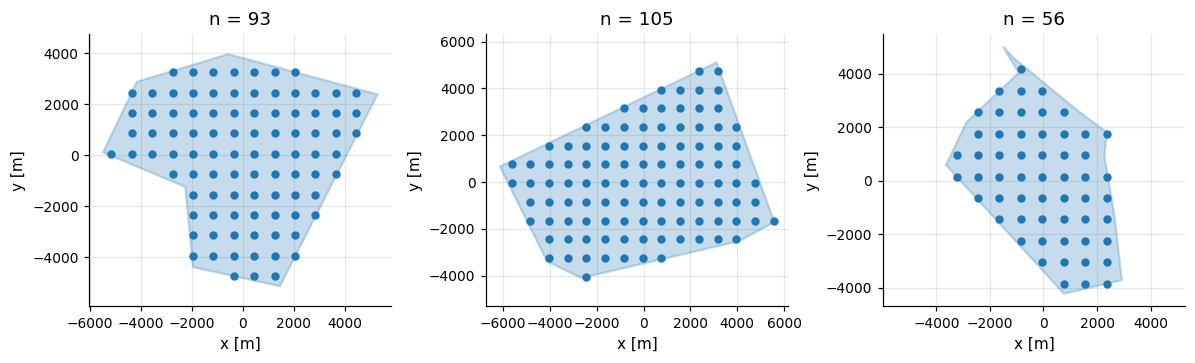
Seeds are derived per scenario, so farm i is the same however many are drawn.
The six layers#
Layer |
What it decides |
|---|---|
boundaries |
the farm area, including holes, partitions and regions |
strings |
optional line guides to place turbines along |
layouts |
exact turbine placement inside the area |
surfaces |
optional terrain or bathymetry |
resources |
wind conditions, sampled with stability |
turbines |
turbine models, per position |
A scenario is a Farm, or a Cluster when n_farms
is given or domain scatters a region of sites.
Where to go next#
Quickstart, a first farm and population
Concepts, the model behind the sampler
Layout families, every placement method
Populations, ranges, choices and links
Wind resources, direction, speed, stability and turbulence